TRADIES UP, BUT CLERKS & SALES JOBS DISAPPEAR
Category:Labour Market,Labour Market 2016,Labour Market 2017,National 2019The national Year on Year employment to population ratio and the participation rate stopped their downward slide during the February labour market quarter and during the May quarter both were moving in a positive direction.
If we smooth the original data out to a 12-month moving average we see the start of what looks like an upward turning point in the employment trends to the end of May and the national figures for June and July were reasonably encouraging.
But a detailed examination of the figures by industry and occupation infer some caution should be exercised.
Industry and Occupational Breakdown of National Data.
By industry, over the past year, agriculture continued what looks like a long term structural decline in jobs, manufacturing showed some signs of life, but construction was still in good shape, as was hospitality.
IT and Media had some short-term gains, but the only consistently strong private sector industry remained Professional Services, (such as lawyers, architects, engineers, accountants) with nearly 63,000 jobs created over the past year and 300,000 jobs in the decade since the GFC.
The predominantly public sector funded or regulated industries of Public Admin, Education and Health remained the biggest drivers of jobs growth, with 45 percent of all jobs created over the past 12 months and 50 percent over the past decade.
When we look at the ABS labour market table showing the narrowly defined version of public sector vs private sector for Occupations, rather than by Industry, we see 41 percent of jobs by occupation last year were created directly by the three differing levels of Government in the public sector, instead of the long-run figure of about 12.5 percent.
In the private sector, 138,400 jobs were created and 74,500 were professionals, but private sector managers (and farmers) went backwards by 13,100 jobs. The hollowing out of female middle-class occupations by digital disruption continued, with 41,800 clerical and receptionist jobs going, virtually all of them full time, even as 42,200 sales jobs also disappeared.
The positive figures in the private sector side of the occupation table came from the creation last year of 76,600 full-time jobs for Tradies and Technicians. There were also an extra 91,200 mostly full-time jobs for the semi-skilled and unskilled blue-collar workers (machine operators, drivers, labourers and cleaners). However, the bulk of these jobs were low paid and those that weren’t, such as Tradies, were coming off a very low base in mid-2016, keeping wages low.
So where were these middle class white collar jobs lost and where were the blue-collar jobs gained?
Regional Variations.
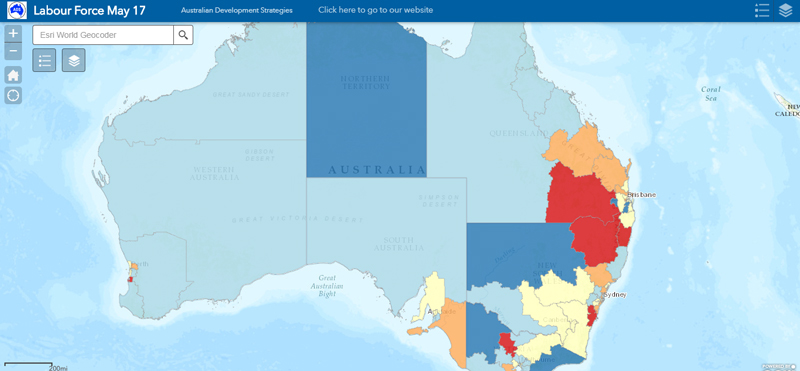
The earlier post-GFC map link and the latest map link are shown here.
The online maps show the more recent national recovery in blue collar jobs seems to have also driven up employment levels and participation rates in many mixed working class and agricultural regions on the fringes of our major cities, like La Trobe – Gippsland in Victoria and Logan – Beaudesert in Queensland.
In New South Wales, the formerly hard hit and relatively low SES remote and rural regions like Murray, and Far West and Orana have shown a post GFC recovery and a bounce-back of jobs under threat from technology which is supported by both the national summary data and the regional data.
Well outside the capital cities, we saw a strong local recovery in the jobs market include many working-class economies which had been doing it tough in the eight years since the GFC and these include Townsville – which is genuinely heartening to see – along with other Queensland regions like Toowoomba, Ipswich, Cairns and Mackay. So, we’re seeing some growth, but from historically very low base levels.
When it comes to job losses, it’s a little surprising that some of the richer inner-city regions of Sydney, Brisbane and Perth were shedding jobs in the 12 months to May 2017.
Demographic Profiles.
After running these figures through our database for some simple correlations, we saw that the (lower SES) regions which gained the most jobs in the 12 months to May 2017 were those containing lower income, young parents, with few educational qualifications and little vocational training and living in what seemed to be often overcrowded, State rental housing, with younger children.
We saw a mix of the more evangelical religions, like Seventh Day Adventist and Other Protestant, which we note often in the urban fringe seats of south east Queensland, along with Aboriginal Traditional Religions and Languages from regions like the NT Outback and Far West NSW.
Those regions heading backwards during the last year were older, specifically aged from 55 years and above. They were also reasonably well off. Their residents tended to be retired, relying on superannuation and Government pensions for income.
Mortgage stress made a showing here and this could be a pointer to middle class persons in their late fifties, transitioning to retirement and building up super balances to discharge their mortgage only when old enough to receive the aged pension.
Finally, we should note that, while there were only small drops in the national summary figures for women in full time real estate jobs, those regions across Australia with the greatest proportion of real estate agents were shedding jobs over the past year and it was statistically significant to 99.9 percent confidence levels.
The bounce back from blue collar jobs during the past year is a welcome sign of some recovery in the private sector, but strong bias towards public-sector jobs growth over the last 12 months infers that the apparent healthy recovery in the national labour market figures may not be sustained.


