

Queensland vote a pivotal moment for Greens
Category:Election Profiles,QLD,Qld Election 2024I wrote a Queensland State election preview for the Australian Financial Review which appeared at the weekend and the link is here, albeit behind the AFR paywall.
https://www.afr.com/politics/federal/queensland-vote-a-pivotal-moment-for-greens-20241024-p5kkyl
The story is headlined: Queensland vote a pivotal moment for Greens, as it analyses the electoral fortunes of the Greens since the party rose from the ashes of the old Australian Democrats 20 years ago. The story explored the demographics underlying the fact that the Greens’ vote has remained frozen at between eight and ten percent since the early noughties and speculated on what the new aggressive Greens approach to the ALP could mean last weekend for both the Greens and the ALP. And of course for the LNP.
On Sunday the team at ADS did some preliminary follow-up profiling of the most recent actual votes and swings for the two major parties, after preferences, and for the Greens Primary Vote and Swing and I wrote a review of this research for the AFR which you can find here:
https://www.afr.com/politics/labor-can-take-no-comfort-from-queensland-election-20241027-p5kllo
The article is headed Labor can take no comfort from Queensland Election. The implications of the results for Queensland Federal seats are canvassed and this now depends largely on how effectively the new Premier David Crisafulli governs the state during the next six months and on whether State Labor can accept the verdict of the electorate and move to recover its lost support outside the southeast corner of the State. The story outlines the demographics the Greens lost, in pursuit of primary votes from Labor by blocking Labor Legislation in the Senate with the support of the Coalition, rather than by working with the Labor Government to secure acceptable amendments. The story also charts some of the impacts of the election boondoggles offered by the State ALP Government before the election. Did any of them work?
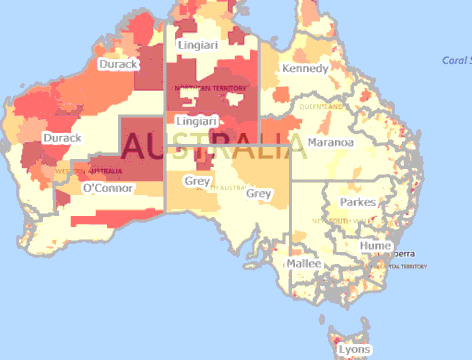
You can do some of your own analysis of these questions by looking at the map prepared by our ADS spatial science expert Dr Jeanine McMullan. https://egs-au.maps.arcgis.com/apps/webappviewer/index.html?id=3e7a2e2105974c06bf22ea7d4991a32f Jeanine has published the Esri map to the public, so access is free. It shows the ALP/LNP 2PP votes and swings and the Greens Primary votes and Swings. To help you get some feel for the impact of the State seat results for the next Federal election, Jeanine has superimposed the boundaries of Queensland Federal seats over the state seat results.


 QLD STATE ELECTION REPORT April 2009_5.pdf

